


I see a lot of traders searching about Boom 1000 index information. Even in my Telegram and WhatsApp groups newbies want to understand how the index moves and behaves, especially how it spikes.
To answer those questions, I did an in-depth analysis of the index. What you will read in this guide is a scientifically researched information that you can use to attack this index.
🔹 What You Will Learn
- The best days to trade Boom 1000 (based on real daily movement)
- The best sessions and hours to catch spikes
- Which days and times to avoid (slow, choppy conditions)
- How many spikes actually occur per day on average
- What kind of strategies work best by day and session
- Point-to-dollar conversion rules for real risk management
🔧 How This Data Was Collected
To get a real edge, I didn't guess.
I downloaded every 1-minute candle from January to June 2025 for Boom 1000 on Deriv. Over 250,000 candles were analyzed to extract:
- Daily range (in points and dollars)
- Session-based volatility patterns
- Spikes (defined as candles moving ≥ 40,000 points)
No hype. No random tips. Just raw, clean stats.
In short, this is the most reliable Boom 1000 index guide on the internet today.
Min Deposit: USD 1
Total Pairs: 100+
Regulators: MFSA, LFSA, VFSC, BVIFSC
💵 Boom 1000 Index: Points to Dollar Conversion Guide
Boom 1000 uses a 5-digit price scale — and the actual tick value is different from other synthetic indices.
Most importantly:
Minimum lot size for Boom 1000 Index = 0.20
At this size, 50,000 points = $1.00
| Lot Size | Dollar per Point | Example: 50,000 pts |
|---|---|---|
| 0.20 (min) | $0.00002 | $1.00 |
| 0.50 | $0.00005 | $2.50 |
| 1.00 | $0.00010 | $5.00 |
So if Boom 1000 moves 50,000 points (which is very common for a spike), you're making $1.00 at minimum lot size of 0.2.
📦 Boom 1000 Index on MT4 vs MT5: What You Need to Know
One of the most common beginner questions is:
“Can I trade Boom 1000 Index on MT4?”
Here’s the truth 👇
🚫 Boom 1000 is not available on MT4.
Deriv does not support synthetic indices on MetaTrader 4. If you see videos or websites saying otherwise, they’re either outdated or misleading.
✅ You can only trade Boom 1000 on MT5 — specifically through a Deriv Standard Account inside the Deriv MT5 platform.
🧭 How to Access Boom 1000 on MT5:
- Sign up for a Deriv account here
- Open a Standard MT5 Account
Need help opening your account? See this step-by-step guide with screenshots
➡️ How to open A Deriv Synthetic Indices Account.
After opening the account proceed to set up MT5.
- Download Deriv MT5 (not regular MetaQuotes MT5)
- Log in using your Synthetic account credentials
- In Market Watch, look under the Boom and Crash section
- Double-click Boom 1000 Index to start trading
🛠️ Need help setting up your Deriv MT5?
👉 Read this full guide on trading Boom 1000 index on MT5
🗓️ Best & Worst Days (Based on Range)
First, what do we mean by “range”?
Range is simply the total number of points the index moved in one day — from midnight (00:00 UTC) to the next midnight (24:00 UTC). We’re talking about the full high-to-low movement during that 24-hour period.
For this breakdown, I used the minimum lot size of 0.20 (which is what Boom 1000 allows) to calculate the dollar value of those moves.
I then took all the Mondays, Tuesdays, etc., over a 6-month period — and calculated the range for each of those days.
For example, I looked at the range for every Monday, added them all up, and divided by the number of Mondays. That gave me the average range for a Monday.
So what does that mean in real terms?
Let’s say it’s a Monday, and you opened a single 0.20 lot trade at the start of the daily candle — and you held it until the end of the day.
Based on the average range, you would have made (or lost) around $62.21, depending on whether your direction was right.
The table below shows which days had the biggest and smallest average movements.

🔥 Highest Volatility Days
Across the 6-month window, these were the most active days:
| Day | Avg Range (pts) | USD Value (at 0.20 lot) |
|---|---|---|
| Wednesday | 3,722,376 pts | $74.45 |
| Sunday | 3,504,357 pts | $70.09 |
| Friday | 3,409,129 pts | $68.18 |
💤 Slowest Days
| Day | Avg Range (pts) | USD Value (at 0.20 lot) |
|---|---|---|
| Monday | 3,110,254 pts | $62.21 |
| Tuesday | 3,202,027 pts | $64.04 |
⚖️ Average Movement Days
| Day | Avg Range (pts) | USD Value (0.20 lot) |
|---|---|---|
| Thursday | 3,300,274.62 | $66.01 |
| Saturday | 3,290,863.85 | $65.82 |
🕒 Boom 1000 Sessions Compared: When Does It Move Best?
Boom 1000 runs 24 hours a day, 7 days a week. But it doesn’t move the same way all the time.
Just like in forex where you have London and New York sessions, synthetic indices like Boom 1000 have clear time-based patterns too.
I wanted to know:
Which part of the day gives the biggest movement?
When do spikes and trends happen most often?
So I broke each day into 4 trading sessions based on UTC time (which is what Deriv uses), and then calculated how much Boom 1000 actually moved in each session — using the true high-to-low range over 6 months of 1-minute candle data.
🧮 How I Measured It
For every single day, I:
- Took the highest and lowest price inside each 6-hour session
- Subtracted them to get the session’s total range (in price units)
- Converted that into points, and then into dollar value at the minimum lot size of 0.20
Finally, I averaged the results to get a typical range per session.

💵 Average Boom 1000 Range by Session (0.20 Lot)
| Session | Avg USD Movement |
|---|---|
| Europe (07:00–13:00 UTC) | $36.55 |
| Asia (00:00–06:00 UTC) | $34.64 |
| Late (19:00–23:59 UTC) | $32.42 |
| US (14:00–18:00 UTC) | $29.33 |
🔍 What These Results Tell Us
🔥 Europe Session (07:00–13:00 UTC)
This is the most active window:
- Highest average range
- Reliable spike bursts and trend plays
- Great for scalping or riding intraday momentum
🥷 Asia Session (00:00–06:00 UTC)
Not as quiet as traders think:
- Second highest movement on average
- Often sets the tone for the day (consolidation + breakout setups)
- Good for pending orders or early trend detection
🌙 Late Session (19:00–23:59 UTC)
Surprisingly volatile:
- Moves well into the night (UTC)
- Spikes happen frequently, especially during trend continuation phases
🧊 US Session (14:00–18:00 UTC)
The slowest of the four:
- Still moves, but often more choppy
- Best for patient scalping or cooling down after a volatile day

📌 Bottom Line
Boom 1000 gives real trading opportunities in every session, but if you’re looking for maximum movement, Europe and Asia are your top picks.e during Asia — but it’s usually slower, so adjust your expectations and strategies.
⚡ Boom 1000 Spike Behavior (40,000 pts+ moves)
- Total spikes (Jan–June): 8,497
- Avg spike size: 77,467 points = ~$0.77 (0.2 lot)
- Biggest spike: 283,720 points = $2.83
- Most common spike hour: 13:00 UTC
Average Daily Spike Count
Here’s the average number of Boom 1000 spikes per day (based on our 6-month data, using a 40,000-point spike threshold):
| Day | Avg Daily Spike Count |
|---|---|
| Monday | 70 |
| Tuesday | 73 |
| Wednesday | 71 |
| Thursday | 72 |
| Friday | 72 |
| Saturday | 73 |
| Sunday | 74 |
🆚 Real Example: High Spike Week vs Low Spike Week
Now that you’ve seen the average number of spikes for each day of the week, you might be wondering:
“Do spike counts stay consistent every week?”
The short answer is — no.
Boom 1000 has weeks where it fires off non-stop spikes, and others where it’s more reserved and trend-focused. To help you see this in action, I pulled two real weeks from the 6-month data:
- One week with above-average spikes
- One week with below-average spikes
Use these examples to understand how the rhythm of the market shifts — and why adapting your strategy to the market mood matters.

⚡ High Spike Week (Jan 16–20, 2025)
| Date | Spike Count | Day |
|---|---|---|
| 2025-01-16 | 79 | Thursday |
| 2025-01-17 | 86 | Friday |
| 2025-01-18 | 79 | Saturday |
| 2025-01-19 | 95 | Sunday |
| 2025-01-20 | 70 | Monday |
Total for 5 days: 409 spikes
Average per day: 81.8 spikes
Compare that to a slow week (Feb 15–19):
| Date | Spike Count | Day |
|---|---|---|
| 2025-02-15 | 48 | Saturday |
| 2025-02-16 | 51 | Sunday |
| 2025-02-17 | 46 | Monday |
| 2025-02-18 | 51 | Tuesday |
| 2025-02-19 | 53 | Wednesday |
Total for 5 days: 249 spikes
Average per day: 49.8 spikes

✅ Takeaway
Boom 1000 doesn’t spike evenly every day. Some weeks are aggressive, others slower. That’s why looking at long-term averages (like we did) gives a more reliable picture.
🕒 Want to compare session performance across all Boom & Crash indices?
👉 Check out the full session timing guide here
🌟 Boom 1000 Index Strategy Tips by Day & Session
🗓️ Mondays
- Range: Lower than average
- Strategy: Fade false spikes, wait for retests
🗓️ Thursdays
- Range: Highest
- Strategy: Trend continuation after spike pullbacks (look for spike→retest→breakout)

🕒 13:00 UTC
- Spike hot zone
- Strategy: Enter 2-candle breakouts, use ~20,000 SL with ~60,000 TP (3R)
🕒 03:00 UTC
- Flat range session
- Strategy: Avoid fresh entries; focus on trailing open positions
⚡ Do More Spikes Mean Bigger Daily Range?
This is a question I hear a lot — especially from traders just starting out:
“If there are more spikes in a day, does that mean the market moved more?”
It seems like a fair assumption, right?
After all, Boom 1000 is known for its sharp vertical candles (spikes). So it would make sense that more spikes = more volatility = more profit opportunity.
But I wanted to test that theory using actual data.
🔍 How I Measured It
To break this down, I did two things:
- Counted spikes per day – I defined a spike as any 1-minute candle with a movement above 40,000 points, which is what I observed from multiple zoomed-in screenshots of real Boom 1000 action.
- Measured the full daily range – For each day, I calculated the difference between the daily high and low, then converted that into dollars using the minimum 0.20 lot size.
I then compared the two side by side for every day from January to June 2025, and ran a correlation test.

📊 The Result
- The correlation between spike count and daily range was just
0.11 - That’s a very weak link — close to no correlation at all
💡 What That Means for You
- Just because a day has lots of spikes doesn’t mean the total movement was huge
- Some days move cleanly in one direction without many spikes (pure trend)
- Other days are choppy and full of spikes, but don’t go very far overall
🧠 Real Example
| Date | Spike Count | Daily Range (pts) | USD Range |
|---|---|---|---|
| 2025-04-28 | 85 | 3.27 million | $65.40 |
| 2025-04-24 | 63 | 4.11 million | $82.20 |
So on April 28, there were more spikes, but the total range was actually smaller than April 24, which had fewer spikes but a much stronger trend move.
✅ Key Takeaway
Spikes are great, but don’t rely on them alone.
The best Boom 1000 days often combine trend strength with clean setups — not just a bunch of random spikes.
❗Does Boom 1000 Ignore Stop Loss or Take Profit During Spikes?
Short answer:
Not exactly — but it can feel like it because of how fast price jumps during spikes.
⚙️ What’s Actually Happening?
When Boom 1000 spikes, the price often moves 10,000 to 300,000+ points in a single tick (within 1 second). That’s not gradual movement — it’s a gap jump.
So if your SL or TP is inside that spike zone, price might:
- Skip over it entirely
- Close your order at a worse price (called slippage)
This isn't a bug. It's just how Deriv's synthetic engine processes extreme volatility — there's no liquidity provider, so prices are instant and continuous, but not always precise during large jumps.

🛡️ How to Protect Yourself
Here’s how to trade safer around spikes:
| ⚠️ Risk | ✅ Safer Practice |
|---|---|
| SL/TP skipped due to spike gap | Use wider SL/TP if you're holding during high-risk sessions |
| Price jumps over level | Use market exit instead of pending TP in fast conditions |
| Over-leveraging small moves | Trade spikes with low lot sizes or use manual scalp triggers |
| Slippage on spike reversal | Avoid placing SL/TP too close to current price |
⚠️ Heads up: Boom 1000 spikes can be instant and sharp.
If your stop loss or take profit is too close, it may get skipped or executed at a different price.
This isn’t a glitch — it’s how fast synthetic volatility works. Trade with wide enough buffers and don’t overleverage.
📉 Can You Use TradingView for Boom 1000 Analysis?
Want to analyze Boom 1000 (or any synthetic index) with advanced charting? Deriv now supports TradingView charts inside Deriv X and charts.deriv.com.
You can't trade directly on TradingView.com, but you can view real-time Boom 1000 charts with full indicator support—and then place trades on Deriv.
Check out our full guide on integrating TradingView with Deriv
➝ Deriv TradingView Integration

📈 How to Trade the Boom 1000 Index (What Actually Works)
I see this question all the time:
“How do I trade Boom 1000?”
“What’s the best strategy?”
“When does it spike the most?”
So I built this entire guide around real Boom 1000 data — every candle, every spike, every session.
But let’s break it down in simple terms.
If you're serious about trading Boom 1000, here’s what you need to know:
🧠 First: Understand How Boom 1000 Moves
Boom 1000 is a spike index — which means it randomly shoots up in single explosive candles, sometimes over 200,000 points in 1 second.
But here’s the key most traders miss:
Spikes don’t happen just anywhere.
Boom 1000 tends to spike against short-term pressure or after liquidity traps — especially during Asia or late sessions.
The rest of the time, it moves like a normal chart with trends, pullbacks, and structure.

🕒 Then: Match Your Strategy to the Right Session
Different times of day = different trading behavior.
Here’s what my session analysis revealed:
| Session | What Works Best |
|---|---|
| Asia (00:00–06:00 UTC) | Spikes near support/resistance — good for trap trades or mean reversion |
| Europe (07:00–13:00 UTC) | Cleanest range and trend — great for scalping and breakout setups |
| US (14:00–18:00 UTC) | Slower, more choppy — better for waiting or testing strategies |
| Late (19:00–23:59 UTC) | Surprise spikes often continue trend — good for manual sniper entries |
So instead of blindly trading at any hour, plan around when Boom 1000 behaves how your strategy needs it to.
⚠️ Finally: Respect the Spike
Boom 1000 doesn’t always respect stop-loss or take-profit orders — especially during high-speed spikes. Use the tips given in the section on stop losses and take profits above.
💡 Example Strategy Types
- Spike Scalping: Wait for price to hit a strong support zone during Asia or Late session, then catch the next spike up with tight manual control.
- Trend Riding: Enter small positions during the European session when the market is moving cleanly. Use spike reversals to add more lots.
- Trap & Trigger: Use horizontal levels to place pending buys when price shows early signs of exhaustion.

📊 Boom 1000 Index Spike Setup Example (Structure Break + Retest)
Here’s a real setup I used to anticipate a massive drop on Boom 1000:
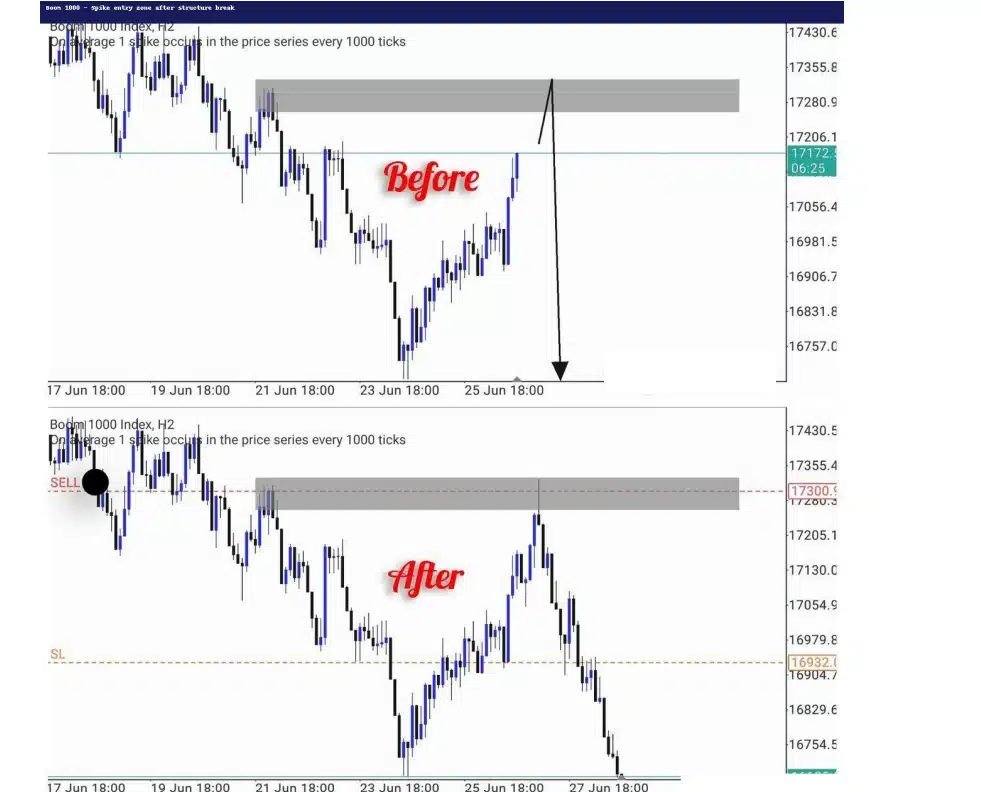
🟢 Before: Price retraced into a previous support turned resistance zone after a structure break.
🔴 After: The zone held, triggering a spike-heavy drop over a couple of days.
✅ This is a textbook Boom 1000 reversal: wait for a structure break → mark your supply zone → watch for retest rejection.
🔁 This setup happened during the London session, one of the highest spike periods on Boom 1000.
📌 Why this matters:
This is not just theory — it’s a real move, with before and after proof, showing how understanding zones + timing can give you clean sniper entries.
📎 Related Guides
🔗 Boom & Crash Scalping Strategy
🔗 Beginners Guide To Boom & Crash Trading
🔗 Boom & Crash Strategy PDF
🔗 Jump Index Strategy Guide
📬 Final Tip
If you’re new to Boom 1000 — test your setups on a demo account first. Then track your best session, most reliable entry, and what spike setups give you the most confidence.
Every trader finds their groove differently.
The key is to trade what you can read and react to — not just what looks good in someone’s video.
🧮 Boom 1000 Margin Requirements: How Much Do You Need to Trade?
One of the most common beginner questions I get is: “How much do I need to fund my account to trade Boom 1000?”
So I placed a live 0.20 lot trade and here’s what I got:
💡 Real Trade Snapshot
- Symbol: Boom 1000 Index
- Lot Size: 0.20 (the minimum)
- Entry Price: 17200.1915
- Margin Used: $5.73
- Account Balance: $127.18
- Free Margin Left: $121.00
- Margin Level: 2,211.69%

📊 What This Means
With just $5.73, I was able to open a 0.20 lot trade on Boom 1000. This gives us a solid baseline to calculate the minimum funding needed depending on how many trades you want to place at once:
| Lot Size | Margin/Trade | Margin for 1 Trade | Margin for 3 Trades | Margin for 5 Trades |
|---|---|---|---|---|
| 0.20 | $5.73 | $5.73 | $17.20 | $28.65 |
| 0.50 | $14.32 | $14.32 | $42.96 | $71.60 |
| 1.00 | $28.65 | $28.65 | $85.95 | $143.25 |
📌 Note: Values fluctuate slightly based on Boom 1000 price. These are approximations.
✅ Suggested Account Sizes To Trade Boom 1000 Index
| Trading Style | Minimum Account Size | Notes |
|---|---|---|
| 1 Trade @ 0.20 lot | $10 | Extremely tight margin. Risky. |
| 3 Trades @ 0.20 lot | $25–30 | Recommended minimum for small scalping setups |
| 1 Trade @ 0.50 lot | $20–25 | Slightly more flexible per trade |
| 5 Trades @ 0.20 lot | $50–60 | Safer if you plan to stack or hedge |
| 1 Trade @ 1.00 lot | $35+ | For bigger spike plays |
⚠️ Warning for New Traders
Boom 1000 moves fast, and during spikes your stop loss or TP might get skipped. Always keep:
- Extra free margin to avoid stop-out
- Lot sizes reasonable for your account
- Manual control during volatile hours (Europe session especially)

🧪 Boom 1000 Index Brokers: Who Offers It (and Who Actually Works)
Another question that comes up often is:
“Which broker offers Boom 1000?”
“Can I trade Boom 1000 outside Deriv?”
✅ The Proven Option: Deriv
For now, Deriv is the only trusted and long-standing broker offering the original Boom 1000 index.
They’ve been running synthetic indices for nearly a decade, and Boom 1000 is one of their flagship spike assets.
If you're trading spikes, testing strategies, or building bots — this is the platform that has been tested, tweaked, and refined by thousands of traders over the years.
👉 Open your Boom 1000 trading account with Deriv here.
🧭 An Emerging Option: Weltrade Gain X 999
Recently, Weltrade has entered the game with a set of new synthetic-like indices — and one of them is:
Gain X 999
It mimics Boom 1000 with one upward jump every 1,000 ticks.
This is a new, unproven instrument and we’re still testing its reliability, spike behavior, and chart structure.
It’s not yet clear how the backend engine compares to Deriv’s — but it’s worth exploring if you want to diversify or test outside environments.
👉 Check out Weltrade and explore Gain X 999

🔍 My Tip
If you're serious about spike trading or bot development, stick with Deriv Boom 1000 as your core index.
But if you want to experiment and stay ahead of upcoming alternatives, Weltrade’s Gain X 999 could be a good second option to keep an eye on.
🎯 Final Thoughts — Share Your Boom 1000 Experience
That’s a wrap for now.
I’ve broken down Boom 1000 using 6 months of real data — daily ranges, spikes, sessions, and behavior patterns — so you’re not just guessing.
Now over to you:
What has your experience been like with Boom 1000?
What’s worked for you when it comes to catching spikes?
Which sessions or days do you avoid — and which ones do you trust?
Drop your tips, strategies, or warnings for other traders in the comments.
Also — bookmark this page. I update it regularly to reflect new trends, updated data, and changes in Boom 1000 behavior. Synthetic indices evolve fast, and so should your strategy.
Stay sharp. Trade smart. And keep checking back.

❓ Frequently Asked Questions About Boom 1000 Index
Boom 1000 is a synthetic index created by Deriv. It simulates market behavior with random upward spikes — usually 1 spike every 1,000 ticks. Traders love it for its volatility and scalping potential.
The minimum is 0.20 lot. Unlike forex where you can go lower, Boom and Crash indices have higher minimums, so plan your margin accordingly.
Our data shows European session (07:00–13:00 UTC) has the strongest moves and most consistent spikes. Late sessions also offer good reversals and continuation setups.
The most common Boom 1000 strategies include spike scalping and trend continuation. Spike scalping focuses on catching upward jumps near support zones, while trend strategies work best during high-volume sessions like the European session. Timing and lot size control are essential for success.
Yes, but it’s very risky. With $10 and the minimum lot size of 0.20, you can place one small trade. However, you’ll have very limited margin to survive slippage or losses. It’s better to treat this as a test balance and trade carefully.
To trade Boom 1000 successfully, focus on timing, session behavior, and small lot sizing. Trade during active hours like the European session, wait for price structure confirmation after a spike, and avoid relying solely on SL/TP. Manual control works better on this index.

💼 Recommended Brokers to Explore
Other Posts You May Be Interested In
Best Time to Trade Boom & Crash Indices on Deriv (2025 Day & Session Map)
📅 Last updated: July 10, 2025 ✍️ Written by: Jafar Omar ✅ Fact-checked by: Taylor [...]
HFM Copy Trading Review: ♻ Copy Top Traders Today!
📅 Last updated: November 24, 2023 ✍️ Written by: Jafar Omar ✅ Fact-checked by: Taylor [...]
6 Best Copy Trading Brokers 2024: Profit From Social Trading 📈💡
📅 Last updated: December 1, 2023 ✍️ Written by: Jafar Omar ✅ Fact-checked by: Taylor [...]
10 Most Volatile Volatility Indices on Deriv (Full 2025 Guide) ⚡
📅 Last updated: June 13, 2025 ✍️ Written by: Jafar Omar ✅ Fact-checked by: Taylor [...]
How To Withdraw From Deriv Account 💰 (Complete 2025 Guide)
📅 Last updated: July 26, 2025 ✍️ Written by: Jafar Omar ✅ Fact-checked by: Taylor [...]
Volatility Indices on Deriv: Full Guide to Types, Lot Sizes, Volatility Levels & Best Strategies (2025)
📅 Last updated: June 23, 2025 ✍️ Written by: Jafar Omar ✅ Fact-checked by: Taylor [...]