


Why You Keep Entering Too Early (or Too Late)
If you’ve ever jumped into a Boom or Crash trade only to get wicked out or slapped by a spike the other way…
…it’s probably because you ignored Boom and Crash market structure.
I used to do it all the time.
I’d see a “perfect” setup on M5, click sell, and then boom — spike straight into my stop. Over and over.
The chart didn’t lie. I just didn’t understand the real context.
Let me show you what changed that.
Min Deposit: USD 1
Total Pairs: 100+
Regulators: MFSA, LFSA, VFSC, BVIFSC
🔍 What Is Market Structure in Boom & Crash?
Market structure is simply the natural rhythm of highs and lows on a chart.
It tells you:
- Who’s in control (buyers or sellers)
- Where price is likely to turn
- Whether a spike is continuation or a trap
Boom & Crash might be synthetic, but structure still matters. The market still respects zones, retests, and momentum shifts — especially on the higher timeframes.
📈 How to Read Boom & Crash Charts (For Real Entries)
Let’s be honest — most traders don’t actually read Boom & Crash charts.
They zoom into M1, stare at candles, and guess when the next spike will happen.
If that’s been you, it’s time to shift.
Boom & Crash charts tell a story — if you know what to look for.
🔹 1. Understand the Candle Types
On Boom/Crash indices, two candle types matter more than anything:
| Candle Type | What It Means | What to Watch For |
|---|---|---|
| 🕯️ Spike Candle | Instant move in 1–2 seconds (Boom = up, Crash = down) | Long wick, tiny body |
| 🕯️ Stall Candle | Sideways chop before a spike | Flat, indecisive wicks or doji |
If you see three or more stall candles at a key zone — get ready.
🔹 2. Read the Sequence (Not Just the Candle)
Don’t just focus on one candle.
Watch the pattern of highs and lows:
- Boom 1000 Example:
HL → HL → HH = Bullish. Spike likely continues up. - Crash 500 Example:
LH → LH → LL = Bearish. Spike may drop deeper.
Even when the spike is random, structure usually builds first.

🔹 3. Look Left, Zoom Out
The most obvious spike traps happen because traders ignore context.
If you’re trading on M1, ask:
- Did H1 just break structure?
- Are we inside a higher timeframe demand zone?
- Has this level been tested before?
If yes → expect reaction or reversal.
📌 Tip: Use H1 to read the structure. Use M5/M15 for entries.
🚫 Don’t Make This Mistake:
Trading random spikes on M1 without understanding:
- Where you are in the swing
- Whether price is expanding or contracting
- If the move is a retest or fresh breakout
That’s how you end up entering just before a spike — but in the wrong direction.
✅ Key Rule:
Structure first. Candles second. Indicators last.
If the chart shows a bullish BOS, wait for a pullback — don’t chase the first candle that twitches.
🔑 Key Concepts You Must Know
🔹 1. Break of Structure (BOS)
When price breaks past a previous high or low, it signals a potential trend shift.
Example:
If Boom 500 forms a lower high → lower low → then breaks a lower high, you’ve got a bullish BOS.
👉 Screenshot below
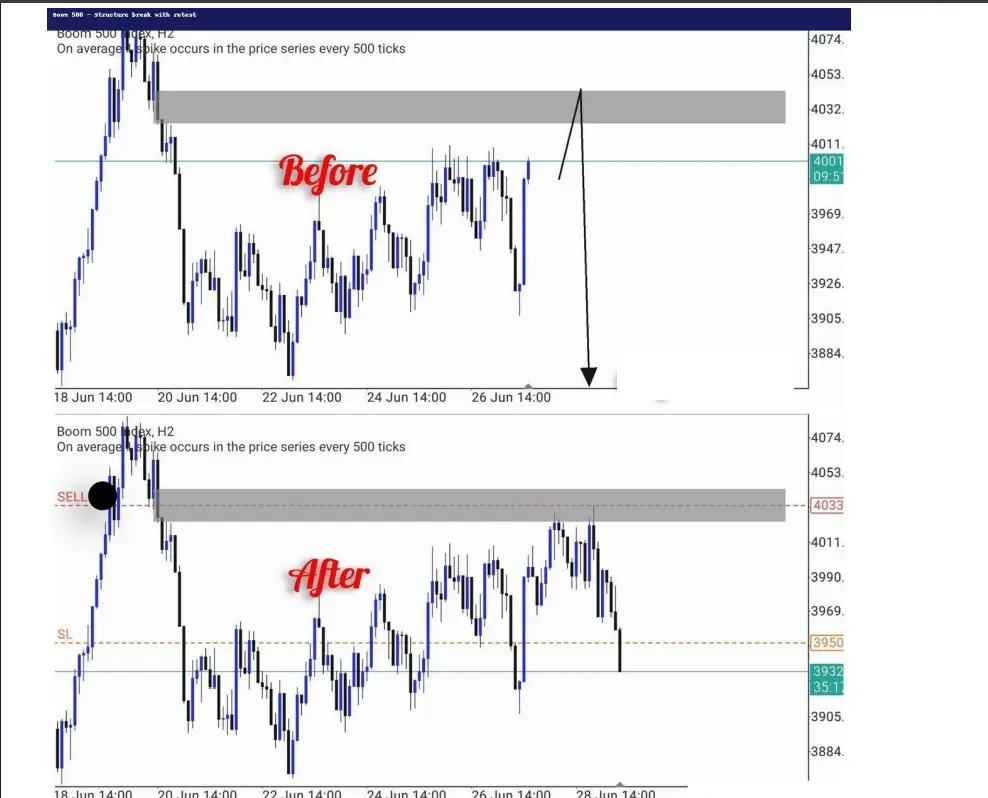
🔹 2. Retests After Breaks
After a BOS, price often pulls back into the broken zone.
This is where most smart entries happen.
I call this the “breathe in, breathe out” moment —
the market just shifted, and now it’s pulling back to inhale before the next move.
🔹 3. Lower Timeframe Trap
M1 and M5 might scream “SELL!” — but if H1 is trending up, you’re often trading against the wave.
I’ve lost count of how many times I shorted into a higher timeframe demand zone without knowing it.
🧱 Real Chart Example: Boom 1000
- H1 breaks structure to the upside
- Price retests the zone with a small wick
- I entered long on the pullback with tight SL
- TP was hit just before next swing high
✅ Screenshot
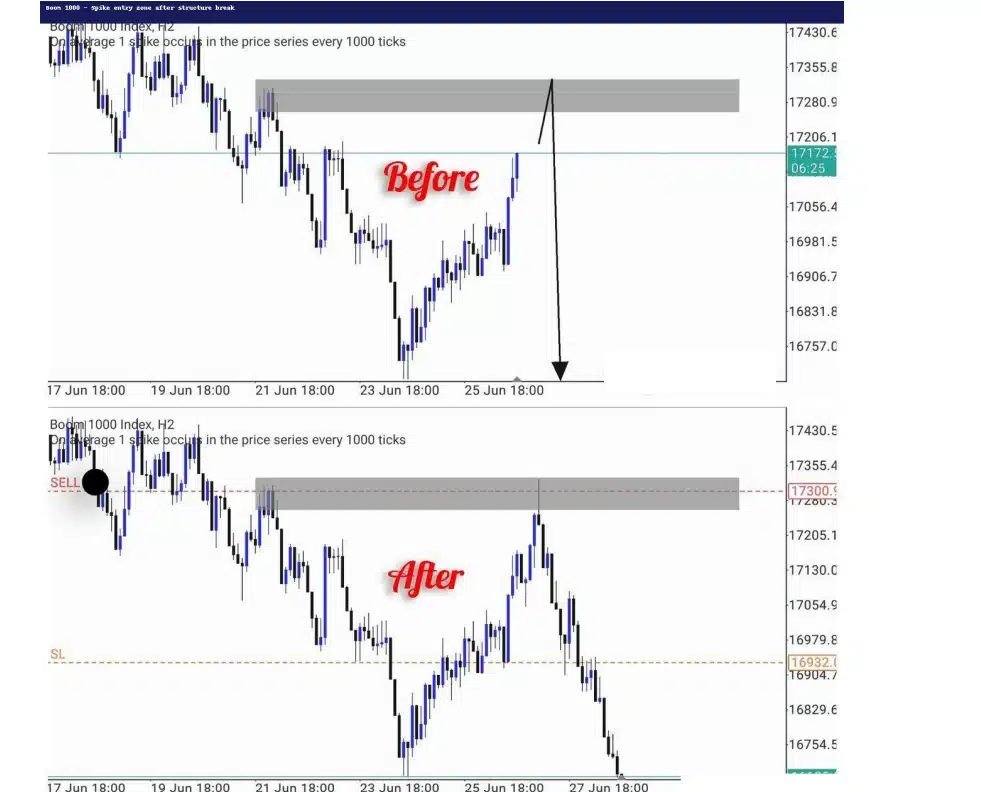
📌 Explanation: BOS → Retest → Continuation spike
🔄 Why Structure Beats Indicators
You can add RSI, AO, Bollinger Bands — but if you trade against the structure, you’re fighting the flow.
When I finally started waiting for BOS + retest zones, even without indicators, my win rate jumped.
Not because I found a “magic setup” — but because I stopped guessing.

🧱 Boom & Crash Zones Still Work (Even on Synths)
I’ve tested this on:
- Boom 500 and 300
- Crash 1000
- Even Step Index (structure is super clean there)
They still respect supply and demand logic — especially when you wait for clean breaks and avoid ranging slop.
📥 Want the PDF Version?
If you haven’t already grabbed the PDF guide with all these chart examples and entry breakdowns:
👉 Download the Boom & Crash Strategy PDF (Free)
📌 Summary – How to Trade Market Structure on Boom/Crash
| What to Look For | Why It Matters |
|---|---|
| Break of structure (BOS) | Signals shift in trend or control |
| Retest of zone | High-probability entry area |
| H1 direction | Avoid trading against major bias |
| Lower timeframes | Only for entries — not structure itself |
| Spikes at zones | Confirmation, not randomness |
🔹 Weltrade – Offering Similar Synthetic Indices (New)
If you’re exploring alternatives to Deriv, Weltrade has introduced Pain X 400 and Gain X 400 — synthetic indices that mimic the spike/drop behavior of Boom and Crash.
But a heads up:
These are relatively new instruments. And like other brokers that tried to copy Deriv’s model, many didn’t last long.
So while it’s a cool option to test structure setups on another platform, I personally treat these as experimental.
They don’t yet have the reliability or consistency that Boom & Crash offers on Deriv.

🔗 Related Guides
If you’re new are competely new to the concept, here’s a quick external definition of market structure from Investopedia
FAQs on Boom and Crash Market Structure
Market structure is the pattern of highs and lows on the chart. It helps you understand trend direction and where price is likely to bounce or break.
Look for price breaking above a previous swing high (in uptrends) or below a previous low (in downtrends). That’s called a BOS — break of structure.
Not always. But when price does come back to retest the broken level and shows rejection, that’s often your best entry signal.
H1 or H2 is best for spotting structure. Then drop down to M5 or M15 for entries. Avoid reading structure on M1 — too much noise.
Yes. It works well on Boom 500, Boom 1000, Crash 1000, and even Step Index. Just make sure you wait for a clear trend and clean retest.


💼 Recommended Brokers to Explore
Other Posts You May Be Interested In
HFM Zero Spread Account Review
📅 Last updated: October 31, 2023 ✍️ Written by: Jafar Omar ✅ Fact-checked by: Taylor [...]
⏱️ When to Trade Each Volatility Index on Deriv — Data-Driven Session Map
📅 Last updated: June 13, 2025 ✍️ Written by: Jafar Omar ✅ Fact-checked by: Taylor [...]
Varus – Deriv Under 5 Bot with Safe PLS Recovery Strategy (2025)🤖
📅 Last updated: June 23, 2025 ✍️ Written by: Jafar Omar ✅ Fact-checked by: Taylor [...]
Boom 1000 Index: Volatility, Spikes & Strategy Breakdown (Jan–June 2025)
📅 Last updated: July 10, 2025 ✍️ Written by: Jafar Omar ✅ Fact-checked by: Taylor [...]
Best Local Payment Methods for Funding & Withdrawing on Deriv (By Country 2025)
📅 Last updated: June 12, 2025 ✍️ Written by: Jafar Omar ✅ Fact-checked by: Taylor [...]
AvaTrade Copy Trading Review 2024: 🔁 Is It Worth It?
📅 Last updated: January 3, 2024 ✍️ Written by: Jafar Omar ✅ Fact-checked by: Taylor [...]