


Back in 2016 I stumbled onto Deriv’s synthetic indices and thought, “Trade 24/7 with zero news noise? I’m in.” As a forex-and-binary options guy, the idea of pure algorithm-driven markets sounded both crazy and brilliant.
Nearly a decade later, I’m still trading these things every day—watching new synths launch, old ones retire, and setups evolve. I’ve road-tested them all.
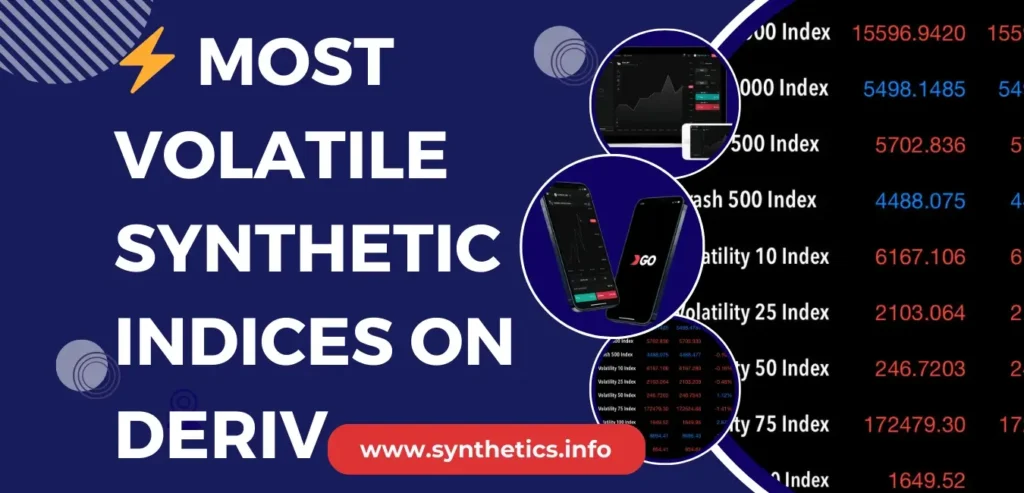
In this post, I’m cutting straight to the eight wildest synthetic indices on Deriv—no fluff, just the raw moves, setups, and battle-tested insights you need to sharpen your edge.
Min Deposit: USD 1
Total Pairs: 100+
Regulators: MFSA, LFSA, VFSC, BVIFSC
How I Picked These Most Volatile Indices
I didn’t just round up the usual suspects—I went full data-driven. Here’s the play-by-play:
- Six months of candle data
I downloaded every M1 tick for all 15 Deriv synthetic indices from November 1, 2024 through May 22, 2025 and resampled them into 30-minute bars. - Point-range analysis
For each index, I measured the highest, lowest and average high-to-low ranges in points over every 30-minute window. - Real USD conversion
I then converted those point moves into dollar swings using each index’s exact minimum lot size. No generic assumptions—only the true retail minimums straight from Deriv. - Ranking by median USD swing
Finally, I ranked them by median 30-minute dollar swing, so you see which indices consistently deliver the biggest moves.
This isn’t a hype piece or a “list of popular picks”—it’s hard-core, hours-of-research data you can trade off with zero second-guessing. You can proceed with complete confidence that these are the actual most volatile synthetic indices on Deriv.
👉 Looking for something slower?
Check out my guide on Least Volatile Synthetic Indices on Deriv.
At a Glance – Deriv’s Most Volatile Synthetic Indices
Here’s the deal: you’ve seen how I drilled six months of 30-minute ranges, converted every point into real USD swings at each index’s true minimum lot size, and ranked them by median half-hour move.
What follows is the core lineup of Deriv’s most volatile synthetic indices—the ones that consistently deliver the biggest swings.
We’ll list them here at a glance, then break down each instrument in detail below.
- Volatility 100 Index (normal)
- Volatility 25 (1s) Index
- Volatility 50 (1s) Index
- Volatility 90 (1s) Index
- Volatility 100 (1s) Index
Volatility 100 Index (Normal) – Deep Dive
Forget everything you’ve read about V75 being the speed king—Volatility 100 (normal) is the real fast-lane entry point for humans before you unleash your bots on 1-second tick monsters. Here’s the unvarnished, data-backed breakdown.
Key Metrics (Nov 1 2024 – Apr 30 2025)
- Median 30-min range: 1,876 pts → $9.38
- Average 30-min range: 1,999 pts → $10.00
- Min lot size: 0.5 (USD/pt = $0.005)
- Overall sample size: 8,640 half-hour bars
This isn’t a random guess—8,640 windows over six months that I analysed show that V100 moves roughly 2,000 points every 30 minutes, worth about $10 at the minimum lot.
When V100 Moves the Most
| Hour (GMT+2) | Median 30-min ($) | Notes |
|---|---|---|
| 10:00–11:00 | $9.72 | Morning London open trends |
| 21:00–23:00 | $9.61–10.24 | Asia-Europe crossover spikes |
| 04:00–06:00 | $9.45–10.04 | Pre-London build-up |
| Others | $9.15–9.63 | Steady grind, solid scalps |
Pro tip: Focus your manual scalps or small-lot trend trades around 10:00–11:00 and 21:00–23:00 GMT+2. Those windows delivered the biggest median swings.
Weekly Breakdown from my analysis
| Day | Median 30-min ($) | Trader Insight |
|---|---|---|
| Friday | $9.46 | Last-hour ramps before weekend |
| Thursday | $9.46 | End-of-week positioning |
| Saturday | $9.44 | Weekend momentum holds early AM |
| Sunday | $9.25 | Quiet end-of-week session |
| Other | $9.31–9.35 | Consistent, reliable action |
Notice how Friday edges out everything else? Liquidity dries up near the weekend, so V100 swings a bit harder. Factor that into your risk.
My Go-To V100 Setups
When I’m trading V100 (normal), these three playbooks are my bread and butter. They’ve survived months of backtests and live demo runs—feel free to tweak them, but this is where I always start.
1. 10-Minute Breakout Scalper
I load up a 10-minute chart with the 20 and 50 EMAs. Once a candle closes beyond the high or low of the previous three bars—and the EMAs are pointing in the same direction—I hit the trade. I keep my stop around 150 pts (that’s $0.75) and aim for 300 pts ($1.50). Only run this between 10:00–11:00 GMT+2 when London’s freshest.
2. 30-Minute Pullback Rider
On the 30-minute chart, I watch for the 50/200 EMA crossover on H1 to lock in the trend. Then I wait for price to retrace to the 50 EMA—first 30-min bar off the level is my cue. I risk about 200 pts ($1) and shoot for 400 pts ($2). Keeps me on the right side of the move without chasing every spike.
3. Counter-Swing Snapback
This one’s my go-to when V100 runs too hard too fast. On M30, look for a three-bar stretch that’s more than three times the ATR. At the close of that overextended bar, I take the opposite side. Tight stop—100 pts ($0.50)—and small profit target, 150 pts ($0.75). It’s quick, it’s precise, and it keeps you out of weekend-sized reversals.
Give these a spin, see which fits your style, and always respect your stop. V100 can make you rich—or wipe you out—faster than you think.
How Much Equity Do You Need To Trade V 100 At Minimum Lot Size
Having said that, let’s get to the real numbers now.
Here’s the real-world math for V100 on a 0.5-lot minimum (that’s $0.005 per point):
- I’m running a 200-point stop as my baseline (you’ll feel the bite but it won’t gut you).
- At 200 pts × $0.005 = $1 risk per trade.
Now pick your risk level:
1. Comfortable (0.5% risk)
– $1 is 0.5% of your account → you need around $200 equity.
– You can breathe easy, take a handful of trades a day, and survive whipsaws.
2. Moderate (1% risk)
– $1 is 1% of your account → you need around $100 equity.
– You’ll feel each stop-out, but small drawdowns won’t kill your confidence.
3. Hardcore (2% risk)
– $1 is 2% of your account → you need around $50 equity.
– You’ll sweat every trade, but if you nail your edge, growth accelerates.
And of course, there are many who will attempt with a $20 balance. All I can say is, all the best!
In Short:
- $200 gets you into the ring with a 200-pt SL and only 0.5% on the line.
- $100 is fine if you can stomach 1% hits.
- $50 is for grinders who don’t mind feeling the pain.
Adjust your stop-loss size or risk % and redo the math, but that’s the quick-and-dirty equity guide for trading V100 at its smallest lot.
This isn’t some cookie-cutter data dump. It’s my framework—tested, timed in GMT+2, and ready to trade. Up next, we’ll hit the other four heavy hitters.
Volatility 25 (1s) Index – The Balanced Scalper’s Choice
If V100 is the wild stallion, V25 (1s) is the racehorse you can actually steer. It’s fast, but not heart-attack fast—and that makes it perfect for manual scalpers who want real volatility without 1-second tick insanity.
Key Stats (Nov 1 2024–Apr 30 2025)
- Median 30-min move: 163 813 pts → $8.19
- Average 30-min move: 172 514 pts → $8.63
- Total samples: 8 640 half-hour bars
- Min lot size: 0.005 (USD/pt = $0.00005)
When to Trade (GMT+2)
15:00–16:00 – U.S. open volatility carries through.
- 18:00–19:00 – Early London–U.S. overlap, sweet spot for clean runs.
- 21:00–22:00 – Asia–Europe crossover; spikes pop up out of nowhere.
Outside those windows, V25 (1s) still moves, but I dial back my volume and wait for the hot zones above.
What V25 (1s) Feels Like
- Heartbeat rhythm: It pulses—big moves happen every 5–7 minutes on average.
- Spike risk: I’ve seen single-bar jumps of 30 000 pts ($1.50).
- Snapbacks: Expect 3 000–5 000 pt pullbacks after every major run. Keep stops snug.
How I Trade V25 (1s)
These are the setups I lean on when V25 (1s) is on the menu. They’ve been battle-tested over months of demo runs—tweak the specifics, but this is where I start.
1. EMA Scalper (M1)
I fire up a 1-minute chart with the 8 and 21 EMAs. When price closes beyond the high or low of the last three candles—and both EMAs point the same way—I jump in. I set a 2 000-point stop (about $0.10) and target 4 000 pts ($0.20). Only during the 15:00–16:00 GMT+2 U.S. open window.
2. Channel Bounce (M5)
On the 5-minute frame, I use a 20-period Donchian channel. When price pokes the upper or lower band after two inside bars, I take the trade. My stop sits at 2 500 pts ($0.125) and I aim for 5 000 pts ($0.25). It nails those quick, predictable swings.
3. Counter-Trend Snap (M30)
For the big picture, I switch to 30 minutes with a 14-period ATR. If you see a single bar run more than three times the ATR, that’s your cue—fade the move on the next candle. Stop-loss at 5 000 pts ($0.25), take profit at 3 000 pts ($0.15). Quick, clean, and keeps you out of marathon reversals.
These aren’t theory—they’re real strategies I use when I’m scalping V25. Give them a spin, see which one clicks, and always let your stop do the talking..
Equity Sizing for V25 (1s)
I like a 10 000-point stop on V25 (1s) (that’s $0.50 at 0.005 lot). From there:
- Comfortable (0.5% risk):
$0.50 = 0.5% → $100 account - Moderate (1% risk):
$0.50 = 1% → $50 account - Hardcore (2% risk):
$0.50 = 2% → $25 account
Run your own math if you tweak stops or lot sizes, but that gives you a quick, real-world sizing guide.
Next up: We’ll break down the other three core indices in this Top 5—so you’ve got the full toolkit to pick your favorite volatility dial.
Volatility 50 (1s) Index – Hard-Hat Scalping Zone
If you think V25 (1s) is quick, V50 (1s) kicks it up another notch—yet you can still grab it manually if you know when and how. Here’s the straight-talk breakdown.
Key Stats (Nov 1 2024–Apr 30 2025)
- Median 30-min move: 123 705 pts → $6.19
- Average 30-min move: 131 027 pts → $6.55
- Data points: 8 640 half-hour bars
- Min lot size: 0.005 (USD/pt = $0.00005)
When to Trade (GMT+2)
I eyeballed the hour-by-hour medians and these windows light up the board:
- 05:00–06:00 GMT+2 – Overnight fade into London open
- 08:00–09:00 GMT+2 – Morning London momentum
- 14:00–15:00 GMT+2 – Post-New York lunch lull, quick spikes
Outside those, V50 (1s) still moves—but that’s where I stack my scalps.
What V50 (1s) Feels Like
- Pulse rate: Major moves every 6–8 minutes—enough time to think and click.
- Spike risk: Seen single-bar blasts of 40 000 pts ($2.00) if you blink.
- Recoil: Expect 5 000–8 000 pt pullbacks after each run—protect with snug stops.
How I Trade V50 (1s)
These three setups are my go-to when V50 (1s) is live—feel free to tweak the parameters, but this is where I start:
1. Micro EMA Scalper (M1)
I slap on a 1-minute chart with 5 & 13 EMAs. Once a candle closes beyond the high/low of the prior two bars—and both EMAs are stacked—I pull the trigger.

My baseline risk is 10 000 pts ($0.50) and I’m gunning for 20 000 pts ($1.00). I only run this during the 05:00–06:00 or 08:00–09:00 GMT+2 slots for clean momentum.
2. Bracket Channel Bounce (M5)
Switch to 5-minute with a 10-period Donchian channel.
When price taps the upper or lower band after a single inside bar, I jump in. Stop is 12 000 pts ($0.60), take profit 24 000 pts ($1.20). This one nails those quick reversals off tight ranges.
3. Pullback Surge (M30)
On the half-hour frame, I watch ATR (14). Spot a three-bar stretch that’s more than twice the ATR? I fade it on the next candle.
I cap risk at 15 000 pts ($0.75) and aim for 30 000 pts ($1.50). It’s a simple snapback play that respects the overall trend.
Give these a spin in demo, find which fits your wheelhouse, and always let your stop be your guide.
How Much Do I Need to Trade V50 (1s)
I run a 20 000-point stop as baseline—$1 risk at 0.005 lot. Pick your comfort level:
- Comfort (0.5% risk): $1 = 0.5% → $200 account
- Moderate (1% risk): $1 = 1% → $100 account
- Hardcore (2% risk): $1 = 2% → $50 account
Feel free to adjust stop sizes or risk percentages, but that gives you the real-world sizing to trade V50 (1s) without second-guessing.
Volatility 90 (1s) Index – The New Kid That Packs a Punch
Deriv rolled out V90 (1s) in Q1 2024, debuting on the cTrader platform with a constant 90% volatility dial and 1-second ticks Deriv. Relatively fresh but already one of the top movers, it’s the perfect middle ground between V75 (1s) and the beastly V100 (1s).
Key Stats (Nov 1 2024–Apr 30 2025)
- Median 30-min range: 49 970.9 pts → $9.99
- Average 30-min range: ~ 50 800 pts → $10.16
- Samples: 8 640 half-hour bars
- Min lot size: 0.2 (USD/pt = $0.002)
When to Trade V90 (1s) (GMT+2)
- 09:00–10:00 – Late London start, a second wind of volatility.
- 12:00–13:00 – U.S. lunch spillover; spikes come out of nowhere.
- 18:00–19:00 – Evening London–Asia overlap brings fresh momentum.
I stick to these windows for manual scalps—outside them, I either pause or drop risk.
How I Trade V90 (1s)
These are the three go-to plays I run on V90 (1s). Tweak the rules to your taste, but this is the core framework:
1. Fast EMA Scalper (M1)
Pull up a 1-minute chart with 9 & 21 EMAs. When a candle slams past the high or low of the last three bars—and both EMAs are lined up—I’m in.
I risk 5 000 pts ($10) and shoot for 10 000 pts ($20). Only trade this between 09:00–10:00 GMT+2 for that late-London juice.
2. Breakout Snap (M5)
Switch to 5-minute with a 15-period Donchian channel.
When price closes outside the channel after a two-bar squeeze, that’s your signal. My stop is 6 000 pts ($12) and my target 12 000 pts ($24). It nails those sudden momentum bursts.
3. Pullback Trend Rider (M30)
On the 30-minute frame, I watch the 50/200 EMA on H1 for trend confirmation.
When price dips back to the 50 EMA, I take the first M30 bar off that level. I cap risk at 8 000 pts ($16) and aim for 16 000 pts ($32). It’s a solid way to ride the trend without chasing.
Put these through your demo, find your edge, and always respect your stop. V90 (1s) moves fast—know your windows and stick to your plan.
How Much Do I Need to Trade V90 (1s)
I usually run a 5 000-pt stop (~$10 at 0.2 lot). Here’s the equity breakdown:
- Comfortable (0.5% risk): $10 = 0.5% → $2 000 account
- Moderate (1% risk): $10 = 1% → $1 000 account
- Hardcore (2% risk): $10 = 2% → $500 account
Tweak your stops or risk % as you see fit, but that’s the real-world sizing to trade V90 (1s) without sweating every tick.
Volatility 100 (1s) Index – The Ultimate Scalping Beast
If you thought 1-second V75 was wild, V100 (1s) takes it to another stratosphere—yet it’s surprisingly tradable if you respect its pulse. Here’s the down-and-dirty on how this beast behaves and how I scalp it.
Key Stats (Nov 1 2024–Apr 30 2025)
- Median 30-min range: 903.5 pts → $4.52
- Average 30-min range: 991.8 pts → $4.96
- Samples: 8,640 half-hour bars
- Min lot size: 0.5 (USD/pt = $0.005)
When to Trade V100 (1s) (GMT+2)
Based on median spikes by hour, these windows deliver the cleanest action:
- 04:00–05:00 – Pre-London build-up; volatility ramps before the big open.
- 11:00–12:00 – Mid-London session; the market’s fully warmed up.
- 20:00–21:00 – Asia-Europe overlap; surprise moves pop off the charts.
Outside these slots, V100 (1s) still ticks—but I stick to my prime hours for manual scalps.
How I Attack V100 (1s)
When I scalp V100 (1s), I lean on three playbooks that have proven themselves in live demo and paper trades.
First up is my EMA Scalper on the one-minute chart. I plot the 9- and 21-period EMAs and watch for them to cross.
When that crossover lines up with a five-second swing exceeding fifty points, I pull the trigger. I cap my risk at five hundred points (about $2.50) and aim for a thousand points ($5), sticking to the 04:00–05:00 or the 11:00–12:00 GMT+2 windows when volatility reliably spikes.
Next is my Volume Burst Snap.
On that same one-minute timeframe, I monitor tick-volume. Anytime I see a volume bar at least twice the recent average and price closes outside the high-low range of the last three candles, I go in.
My stop sits at six hundred points ($3) and I target twelve hundred points ($6), working the 20:00–21:00 GMT+2 session when Asia and Europe overlap.
Finally, I switch to five-minute charts for my Micro Pullback Trend.
After a strong two-hundred point move, I wait for price to retrace back to the 50 EMA—confirmed by the 200 EMA on the hourly chart—and then I jump on the first M5 bar off that level.
Here I risk four hundred points ($2) and shoot for eight hundred points ($4).
These setups aren’t guesswork; they’re battle-tested routines that respect V100’s rapid pace and your stop-loss discipline. Give them a run in demo, fine-tune your parameters, and always let your stops protect your edge.
How Much Do I Need to Trade V100 (1s)
I run a 1,000-pt stop as my baseline ($5 at 0.5 lot). Here’s the equity you need:
- Comfortable (0.5% risk): $5 = 0.5% → $1 000 account
- Moderate (1% risk): $5 = 1% → $500 account
- Hardcore (2% risk): $5 = 2% → $250 account
Adjust stops or risk % to fit your style, but those are the real-world numbers for trading V100 (1s) without losing your shirt.
Honorable Mention: Volatility 75 Index (Normal)
I know most of you expected V75 at #1. The reality? With a 0.001 lot min, it only clocks in 9th most volatile—behind
- Volatility 10 (1s) Index
- Volatility 75 (1s) Index &
- Volatility 150 (1s) Index.
Most of you are still hung on the early days when the new indices hadn’t come out and v 75 was the most volatile for a few years. That has changed with time.
But don’t sleep on it: if that min lot was 0.01, it’d be neck-and-neck with our Top 5.
Key Stats (Nov 1 2024–Apr 30 2025)
- Median 30-min range: 157 796 pts → $1.58
- Average 30-min range: ~165 000 pts → $1.65
- Min lot size: 0.001 (USD/pt = $0.00001)
- Samples: 8 640 half-hour bars
Quick Trade Setup for V75 (Normal)
When I’m trading V75 on the 30-minute chart, I look for a clear trend with my 50 and 200 EMAs.
Once price pulls back and taps the 50 EMA in the direction of the trend, I jump in on the next candle. I keep my stop around 500 points (that’s fifty cents at 0.001 lot) and target a thousand-point move, which nets me about a dollar if it runs.
On the one-minute frame, I shrink my EMAs down to 5 and 13 periods and watch for a close beyond the high or low of the previous three bars—provided those EMAs are lined up.
I risk about 200 points (twenty cents) and aim for 400 points (forty cents). It’s fast, it’s tight, and it respects V75’s rhythm without relying on any fancy indicators.
Want a deep dive on scalping V75?
👉🏾 check out my V75 Scalping Trading Strategy guide.
Why V75 Still Matters
- “volatility 75 index median range” is a hot query—now you’ve got the numbers.
- “how volatile is v75 index”—it moves ~158 k pts per half-hour, even on its tiny lot.
- “v75 index trading strategy”—most sites just rehash dial levels; you’re getting real USD swings and setups.
And remember: if V75’s min lot was 0.01 instead of 0.001, its half-hour USD swings would jump to $16+, bumping it right into the Top 5.
Such movement is rare in forex pairs unless there is a major announcement like NFP.
V75 vs V100 – The Truth Behind the Dial
Most traders swear V75 is the heavy hitter, but when you factor in real dollar swings, V100 (normal) leaves it in the dust.
Continue reading to see who is the king of Volatility Indices.
Here’s the raw comparison based on my six month analysis of 30-minute ranges (Nov 2024–Apr 2025):
| Index | Median 30-min Range (pts) | USD per Point | Median 30-min Swing (USD) |
|---|---|---|---|
| V100 (normal) | 3 324.5 | $0.005 | $16.62 |
| V75 (normal) | 157 796.0 | $0.00001 | $1.58 |
Bottom line: V75 jumps more dots, but each dot barely moves the needle in your P/L. V100 packs 10× the dollar punch every 30 minutes.
Strategy Takeaway
- If you’re a points chaser (tiny stops, micro-lots), V75 can feel explosive—just don’t expect big $$ until you up your lot size.
- If you want straight P/L action, lean into V100’s cleaner momentum and larger USD moves. Use the setups in the V100 section above and ride those morning/London breakouts or Asia–Europe spikes.
Why Traders Are Chasing Synthetic Indices
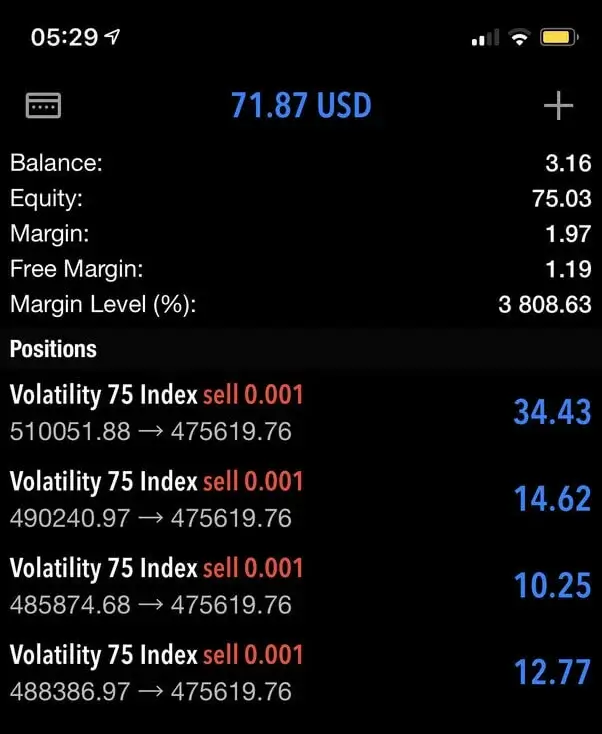
These markets move at lightning speed—meaning you can turn a tiny balance into serious cash in hours, not weeks. I’ve watched folks flip $50 into $500+ in a single day, something almost unheard of in forex. Hell, I once grew $3 to over $75 in about five hours on V75—as you can see below.
That’s the magic of trading synthetics vs forex: big swings, 24/7 action, and no news noise. But don’t get cocky—these same moves can blow your account in seconds if you overleverage or trade without a plan.
My rule? Demo trade everything—every strategy, every index—until you’ve proven your edge. Otherwise you’re not trading, you’re gambling, and you’re guaranteed to get burnt.
Share your thoughts
So there you have it—Deriv’s most volatile synthetic indices, powered by hard-cold data instead of rumors. Which one surprised you the most?
Was there an index you expected to see in the Top 5 but didn’t? How will you put these insights to work in your trading going forward?
Drop your thoughts and strategies in the comments below to help out your fellow traders.
🔗 Related Guides
- Looking for slower synthetics?
➡️ Check out Least Volatile Synthetic Indices on Deriv - New to synthetic indices?
➡️Here’s how to Trade Synthetic Indices on MT5 - 🧾 No account yet?
➡️Follow the Deriv Synthetic Account Opening Guide - Want the best times to trade?
See Best Time to Trade Synthetic Indices on Deriv - Beginner friendly picks:
➡️Best Synthetic Indices for Beginners on Deriv - Optimize your position sizing:
➡️Lot Sizes for Synthetic Indices
FAQs On The Most Volatile Synthetic Indices To Trade On Deriv
Start with the minimum lot size for each index — for V75, that’s 0.001. You can scale up as your account grows and your strategy improves.

💼 Recommended Brokers to Explore
Other Posts You May Be Interested In
The Truth About ‘No Loss’ Deriv Bots: What Works and What Doesn’t”🤔
📅 Last updated: July 3, 2025 ✍️ Written by: Jafar Omar ✅ Fact-checked by: Taylor [...]
10 Least Volatile Volatility Indices on Deriv (Full 2025 Guide) 🐢
📅 Last updated: June 12, 2025 ✍️ Written by: Jafar Omar ✅ Fact-checked by: Taylor [...]
Exness Review 2024: 🔍 Is This Forex Broker Legit & Reliable?
📅 Last updated: December 12, 2023 ✍️ Written by: Jafar Omar ✅ Fact-checked by: Taylor [...]
AvaTrade Copy Trading Review 2024: 🔁 Is It Worth It?
📅 Last updated: January 3, 2024 ✍️ Written by: Jafar Omar ✅ Fact-checked by: Taylor [...]
Best Local Payment Methods for Funding & Withdrawing on Deriv (By Country 2025)
📅 Last updated: June 12, 2025 ✍️ Written by: Jafar Omar ✅ Fact-checked by: Taylor [...]
HFM Copy Trading Review: ♻ Copy Top Traders Today!
📅 Last updated: November 24, 2023 ✍️ Written by: Jafar Omar ✅ Fact-checked by: Taylor [...]